What are biomolecular condensates and why are they important?
Biomolecular condensates are phase-separated structures formed by proteins, RNA, and other biomolecules within cells. Unlike membrane-enclosed organelles, these condensates assemble dynamically and reversibly, regulating key biological processes, including gene expression, stress response, and cell division. Abnormalities in their composition are linked to neurodegenerative diseases and cancer.
Understanding what these condensates are made of and how this composition changes under stress or during disease is critical to modern cell biology and biophysics. However, current tools for measuring the composition of condensates often rely on fluorescent labels that can interfere with their natural behavior.
Summary of the findings
In a 2025 Nature Chemistry study, McCall et al. introduced a label-free method that quantifies the molecular composition of biomolecular condensates using quantitative phase imaging (QPI) and a new analytical framework called ATRI (Analysis of Tie lines and Refractive Index).
Key findings include:
- Accurate, real-time measurement of condensate concentration without labels
- Validation of QPI for native proteins, revealing structural aging and density shifts
- Application of ATRI to multicomponent systems (e.g., RNA with several proteins), resolving up to five solutes
- Discovery that fluorescent tags significantly alter condensate properties
- Evidence of complex, size-dependent behaviors such as ageing kinetics and solvent expulsion
This method enables researchers to track molecular interactions inside condensates with unprecedented clarity without disrupting their natural structure.

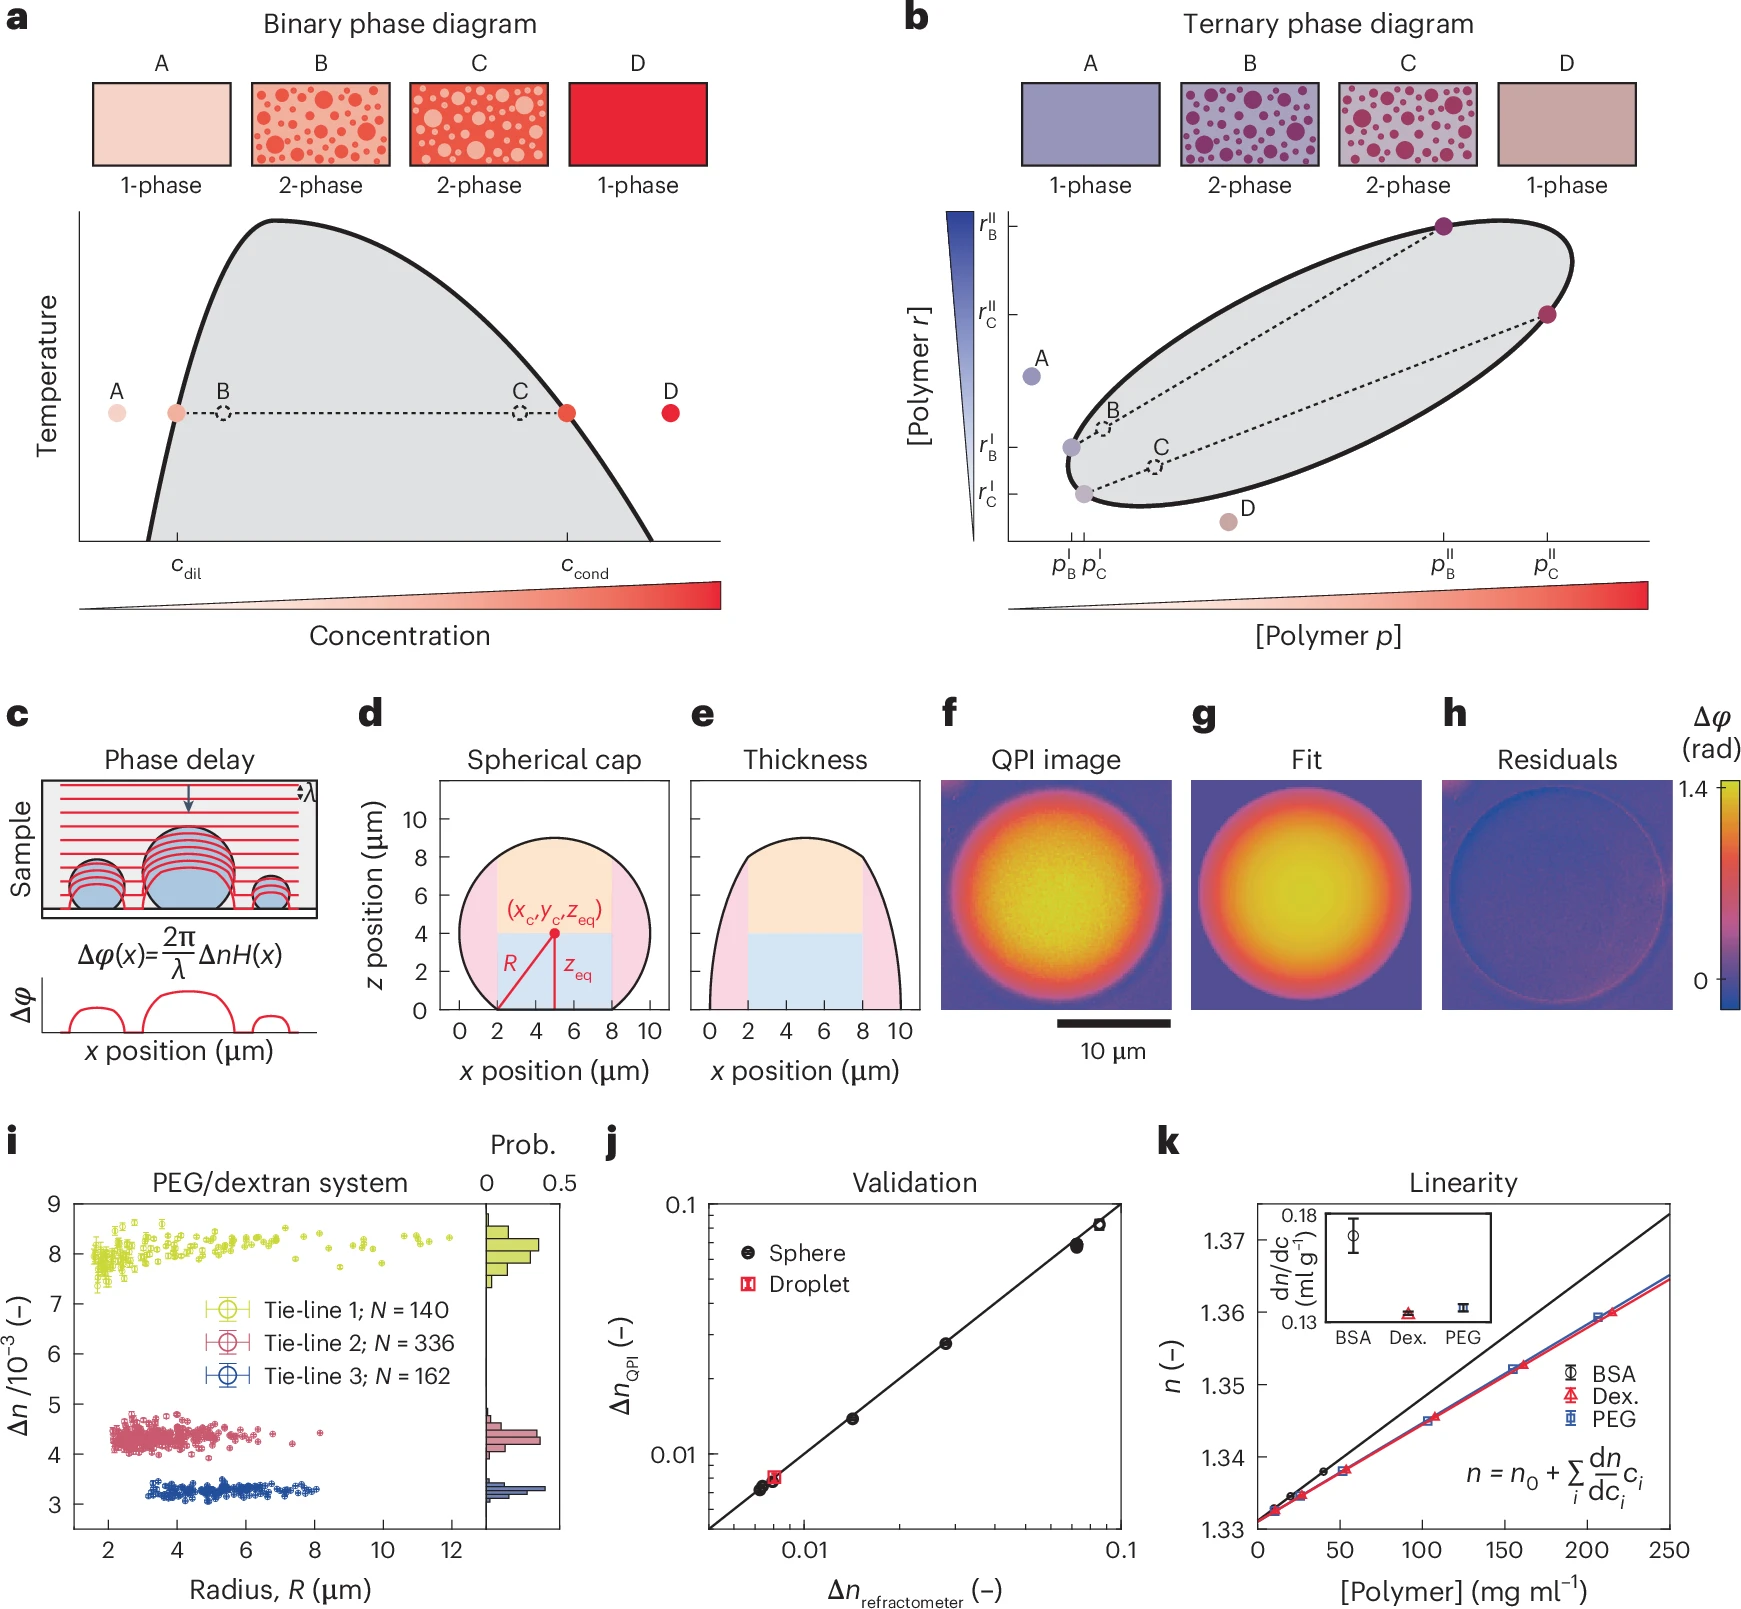
a, Phase diagram in a prototypical binary mixture with sketches of samples prepared in the one-phase (A,D) and two-phase regimes (B,C). Compositions of coexisting phases, cdil and ccond, lie on the binodal curve (solid black) that separates the one-phase (mixed) and two-phase (demixed) regimes. A tie-line (dashed black) connects compositions of coexisting phases to the corresponding average composition (open dashed black circle). Varying average solute concentration in the two-phase regime (grey) changes the relative volumes of coexisting phases but not their composition. b, Phase diagram in a prototypical ternary mixture with sketches of samples prepared at different average compositions. Unlike the binary case, ternary mixtures prepared at different points in the two-phase regime may lie on different tie-lines, yielding compositionally distinct pairs of coexisting phases. c, Schematic of optical wavefronts (red) distorted by droplets on a flat surface (top) and the cumulative optical phase shift (bottom). d, Schematic defining the geometry of a spherical cap. e, Local thickness profile H(x) for the geometry in d. Shading in d,e denotes separate terms in the analytic expression for H(x) (Methods). f, Phase image of dextran-rich droplet on passivated glass. g, Fit of droplet in f to spherical cap. h, Residuals from fit. Scale bar in f–h, 10 µm. i, Refractive index difference ∆n versus droplet radius R extracted from fits to individual dextran-rich droplets obtained from PEG/dextran mixtures prepared on three different tie-lines (colours). Error bars are 95% confidence intervals from fits. Probability histograms at right. j, Mean refractive index differences measured with QPI versus bulk refractometry for PEG/dextran mixtures (red) or silica microspheres in different glycerol–water mixtures (black). Error bars in x are the s.d. of N = 5 repeat measurements. Error bars in y are the s.d. from a population of objects in a single sample. For the PEG/dextran system, N = 140 droplets on tie-line 1. In order of increasing ΔnQPI for the silica bead system, N = 62, 71, 92, 77, 57, 7, 16, 8, 10, 56, 63 or 21 microspheres. Solid line is y = x. k, Refractive index is a linear function of component concentration for three model biopolymers (BSA, dextran, PEG). Data points represent mean ± s.d. of N = 3 repeats. Inset: slopes (dn/dc) for each polymer. Error bars represent 95% confidence intervals from the linear fits in the main panel. – source: link
The terms used in article
Dynamic, membraneless assemblies of proteins and RNA that regulate key cellular processes
The process by which a uniform mixture separates into distinct regions, forming condensates
Optical contrast between dense and dilute phases, linked to solute concentration
New method combining phase diagrams and QPI to resolve multicomponent condensate composition
Common imaging technique based on labels = fluorophore molecules that can emit light of a specific wavelength when excited. Labels bind only to a specific cell structure and allow targeted visualization, though they can alter natural conditions.
How did Q Phase contribute?
- Real time concentration measurements: Measured subtle optical phase differences between phases, converting them into absolute concentration values using refractive index increments.
- Label-free imaging of native proteins: Enabled observation of untagged biomolecules inside live condensates, avoiding perturbation from fluorescent markers.
- High sensitivity in multicomponent systems: Detected individual solute contributions in mixtures of RNA and multiple proteins, crucial for ATRI analysis.
- Non-invasive ageing and dynamics tracking: Revealed structural changes, solvent expulsion, and ageing kinetics in condensates over time, without affecting cellular function.
In summary, Q-Phase provided the resolution, sensitivity, and label-free precision required to uncover new biophysical principles governing condensate behavior, helping move microscopy from visualization to true molecular quantification.
Link to a full article.