

Cell cycle
The cell cycle is a dynamic process where cells tend to grow and duplicate their contents for the subsequent division. Inappropriate cell division or aberrations in cell cycle regulation can lead to significant pathological outcomes such as cancer. Cell cycle pattern can be dramatically impacted by stressful environmental conditions such as hypoxia and malnutrition. On the other hand, stem cells can display unusual features in their cell cycle pattern which is tightly connected to the differentiation state.
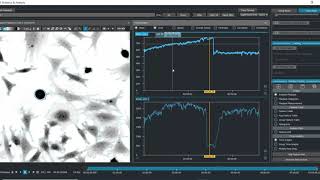
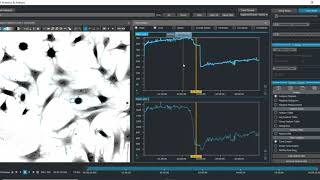
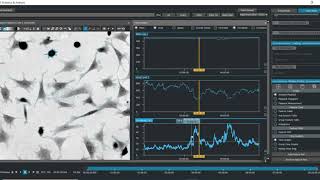
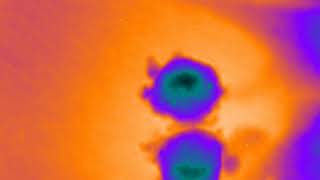
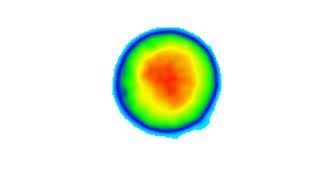
Cell growth is directly proportional to the increase in the cell dry mass during individual cell cycle phases. Using Q-Phase in cell cycle studies represents a great quantitative method for assessing the symmetric and asymmetric cell division, cell cycle arrest, subpopulations that escape the therapeutic cytotoxic effect, doubling time, and others, all within a label-free technology.
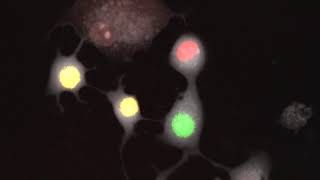
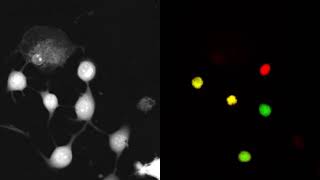
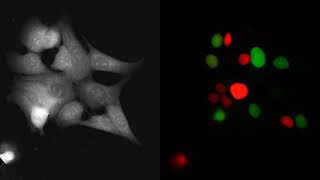
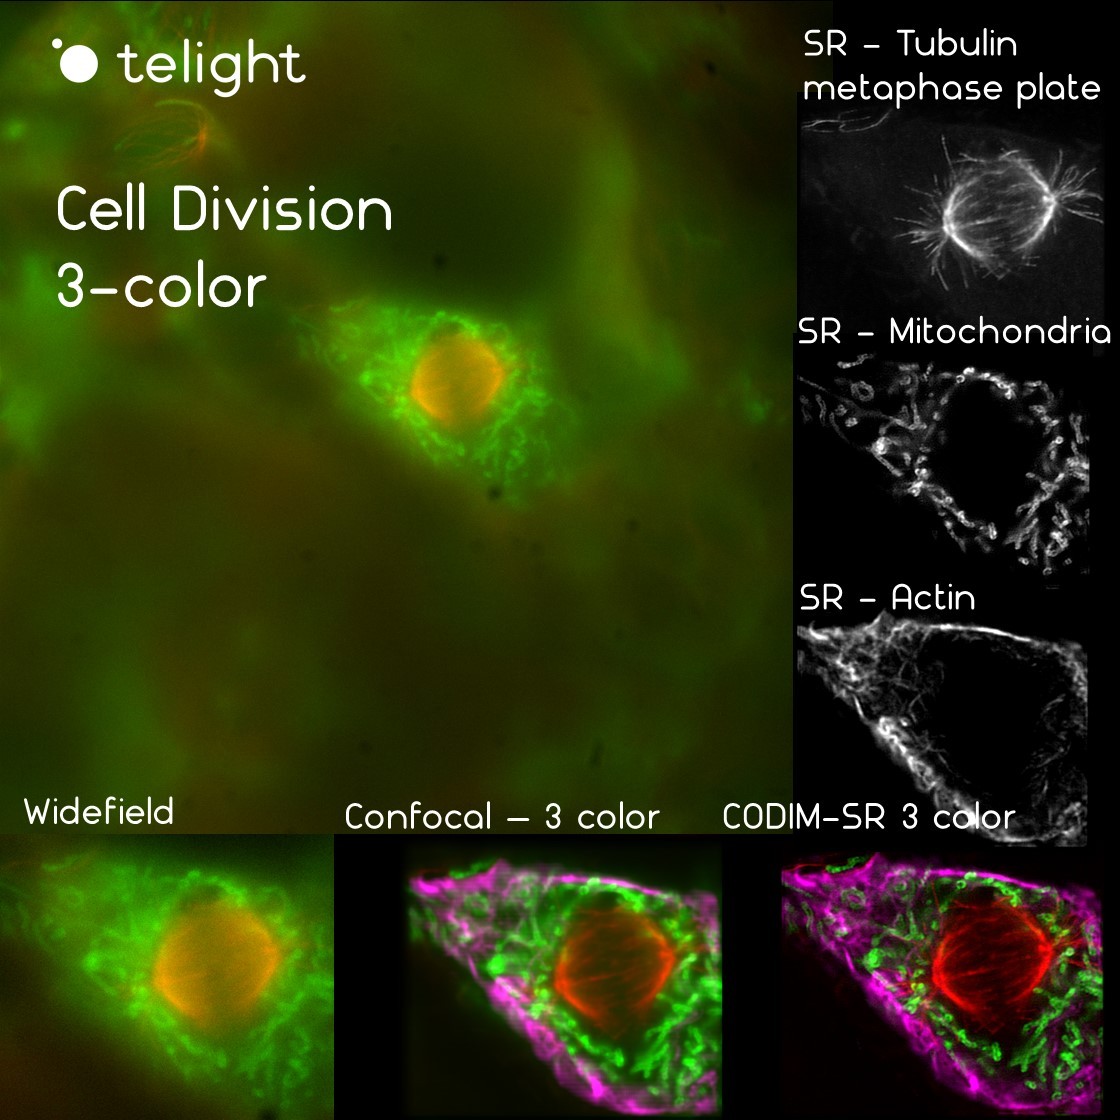
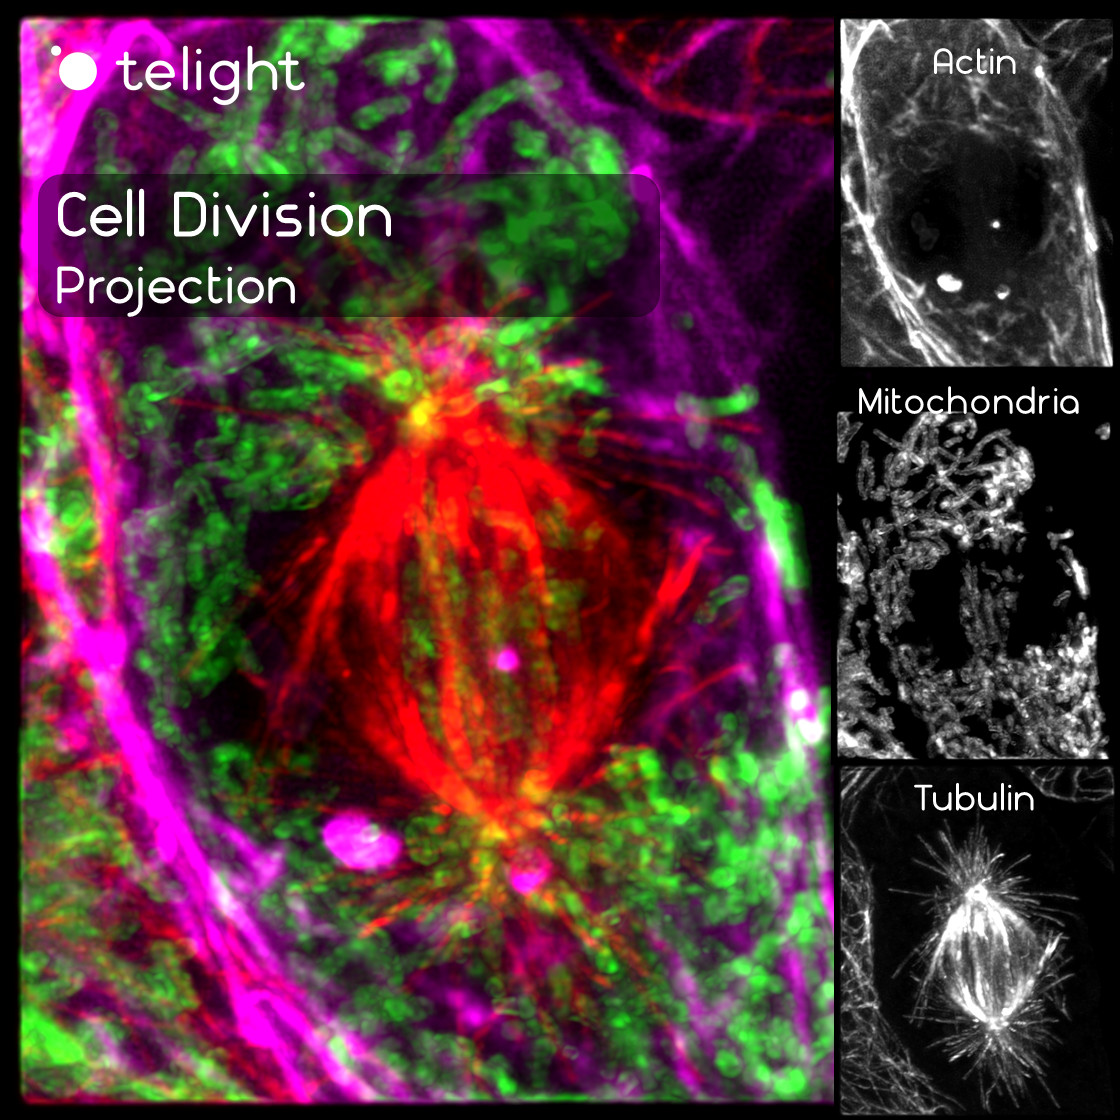
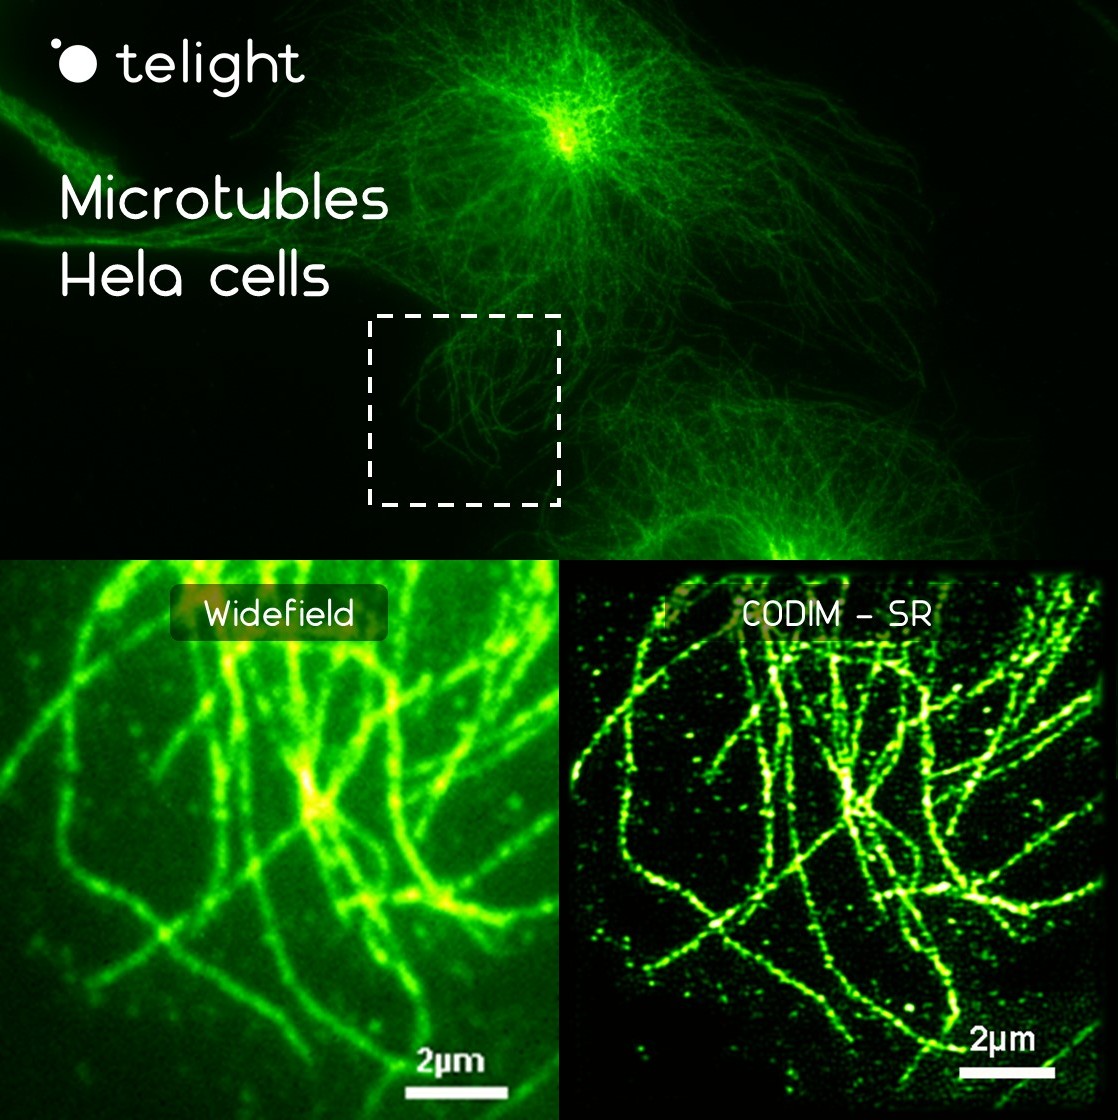
Cell cycle and cell division deregulation are involved in a variety of diseases, especially in cancer, and represent the main study domains in cell biology. Dynamic visualization of the cell cycle through super-resolution LiveCodim imaging could bring new insights into the mechanism involved in this process. For example by visualizing microtubule functioning during mitosis.
Publications
J. Zemanová, et al.
Chk1 inhibition significantly potentiates activity of nucleoside analogs in TP53-mutated B-lyphoid cells
Products
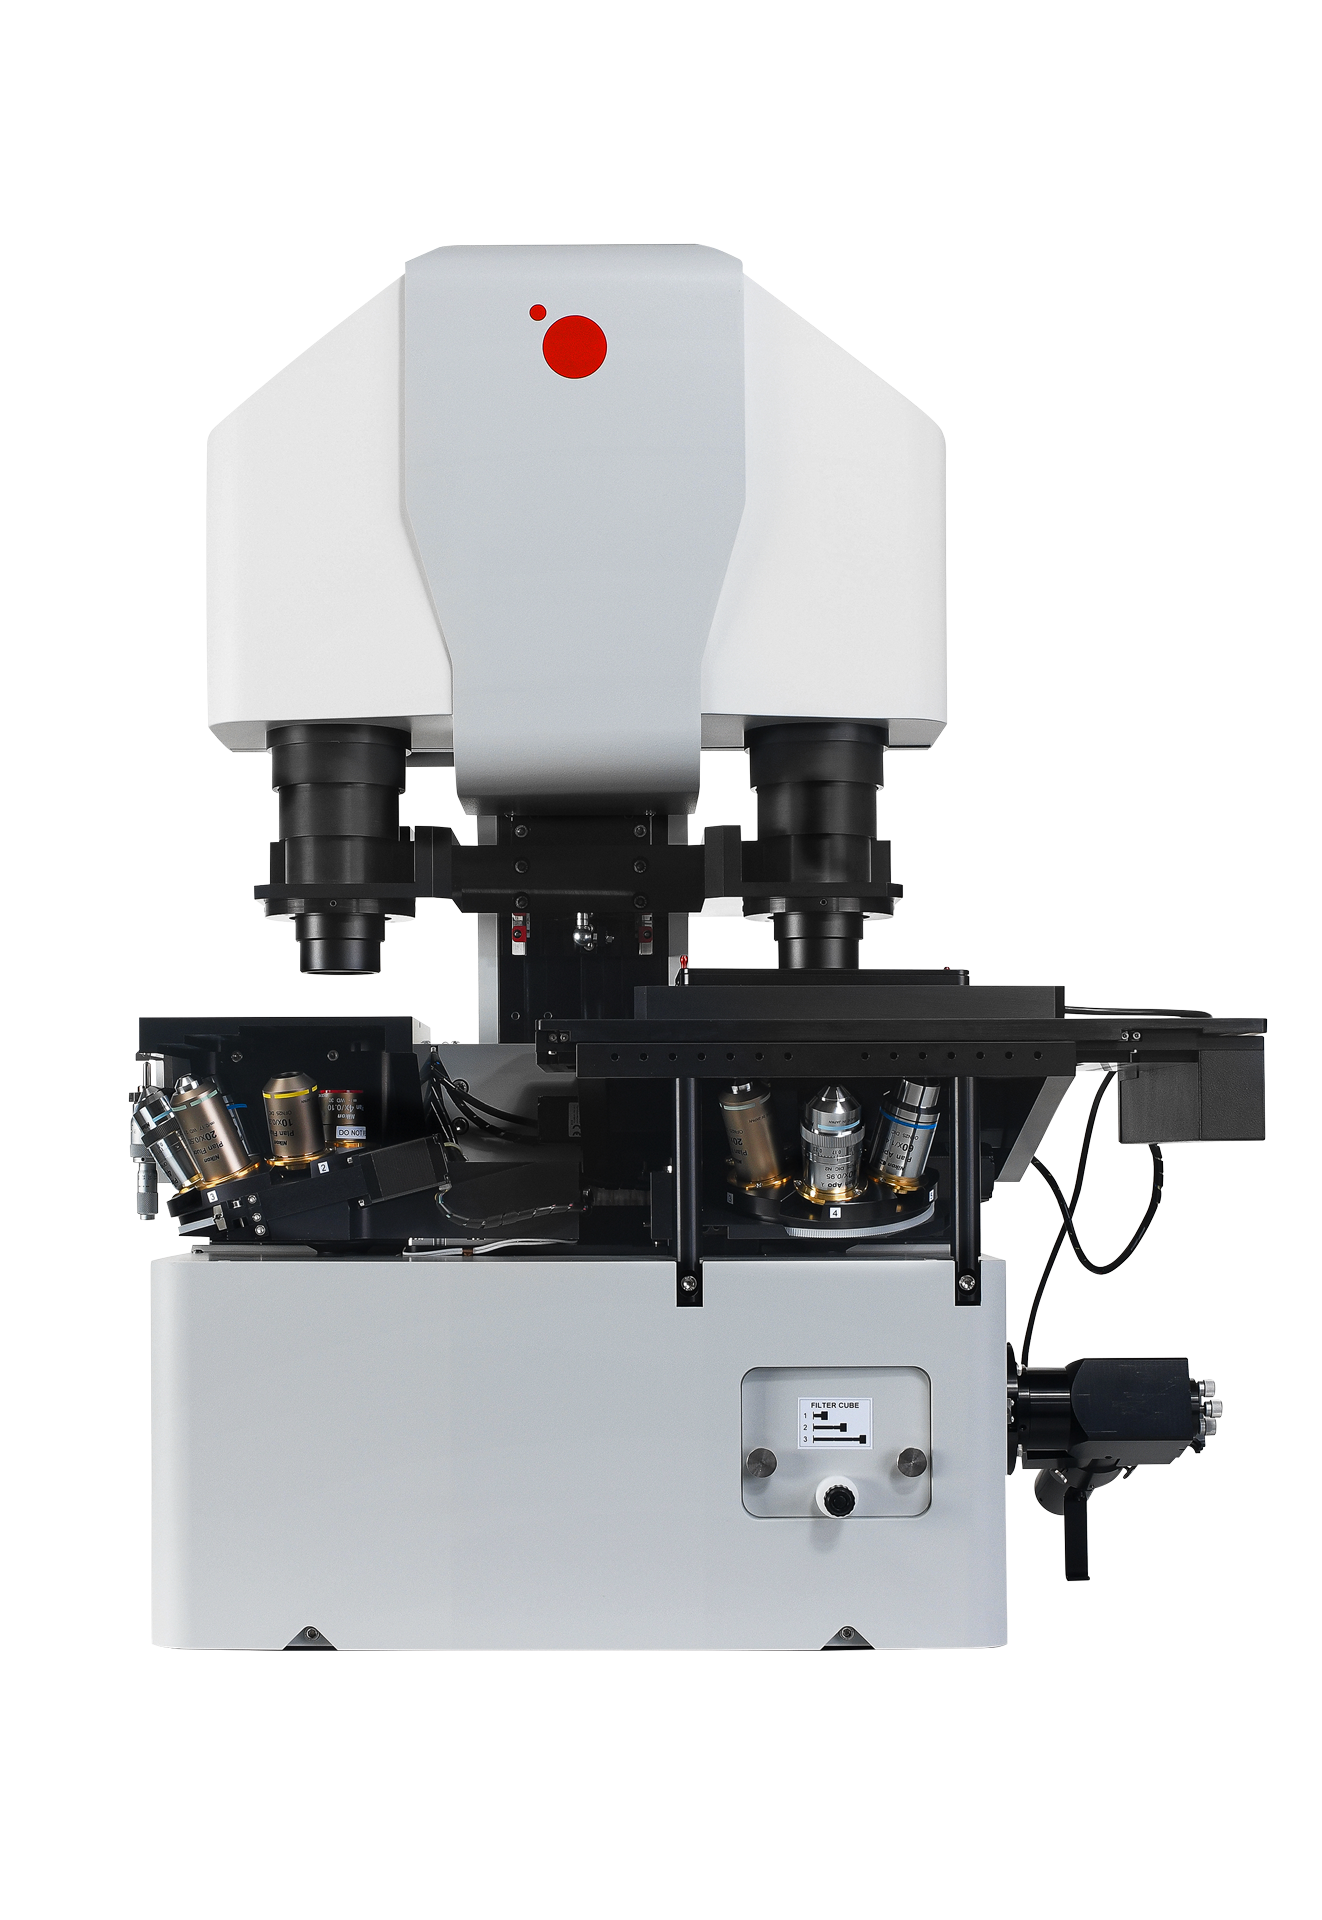
Q-Phase
Quantitative Phase Imaging
Q-Phase is a patented holographic microscope with high detection sensitivity, designed for gentle live-cell imaging.
Q-Phase is an ideal solution for experts who desire precise automated segmentation of individual cells for subsequent data analysis. Q-Phase quickly transforms cell features and dynamics into numerical data suitable for comparisons, correlations, and more detailed statistics.
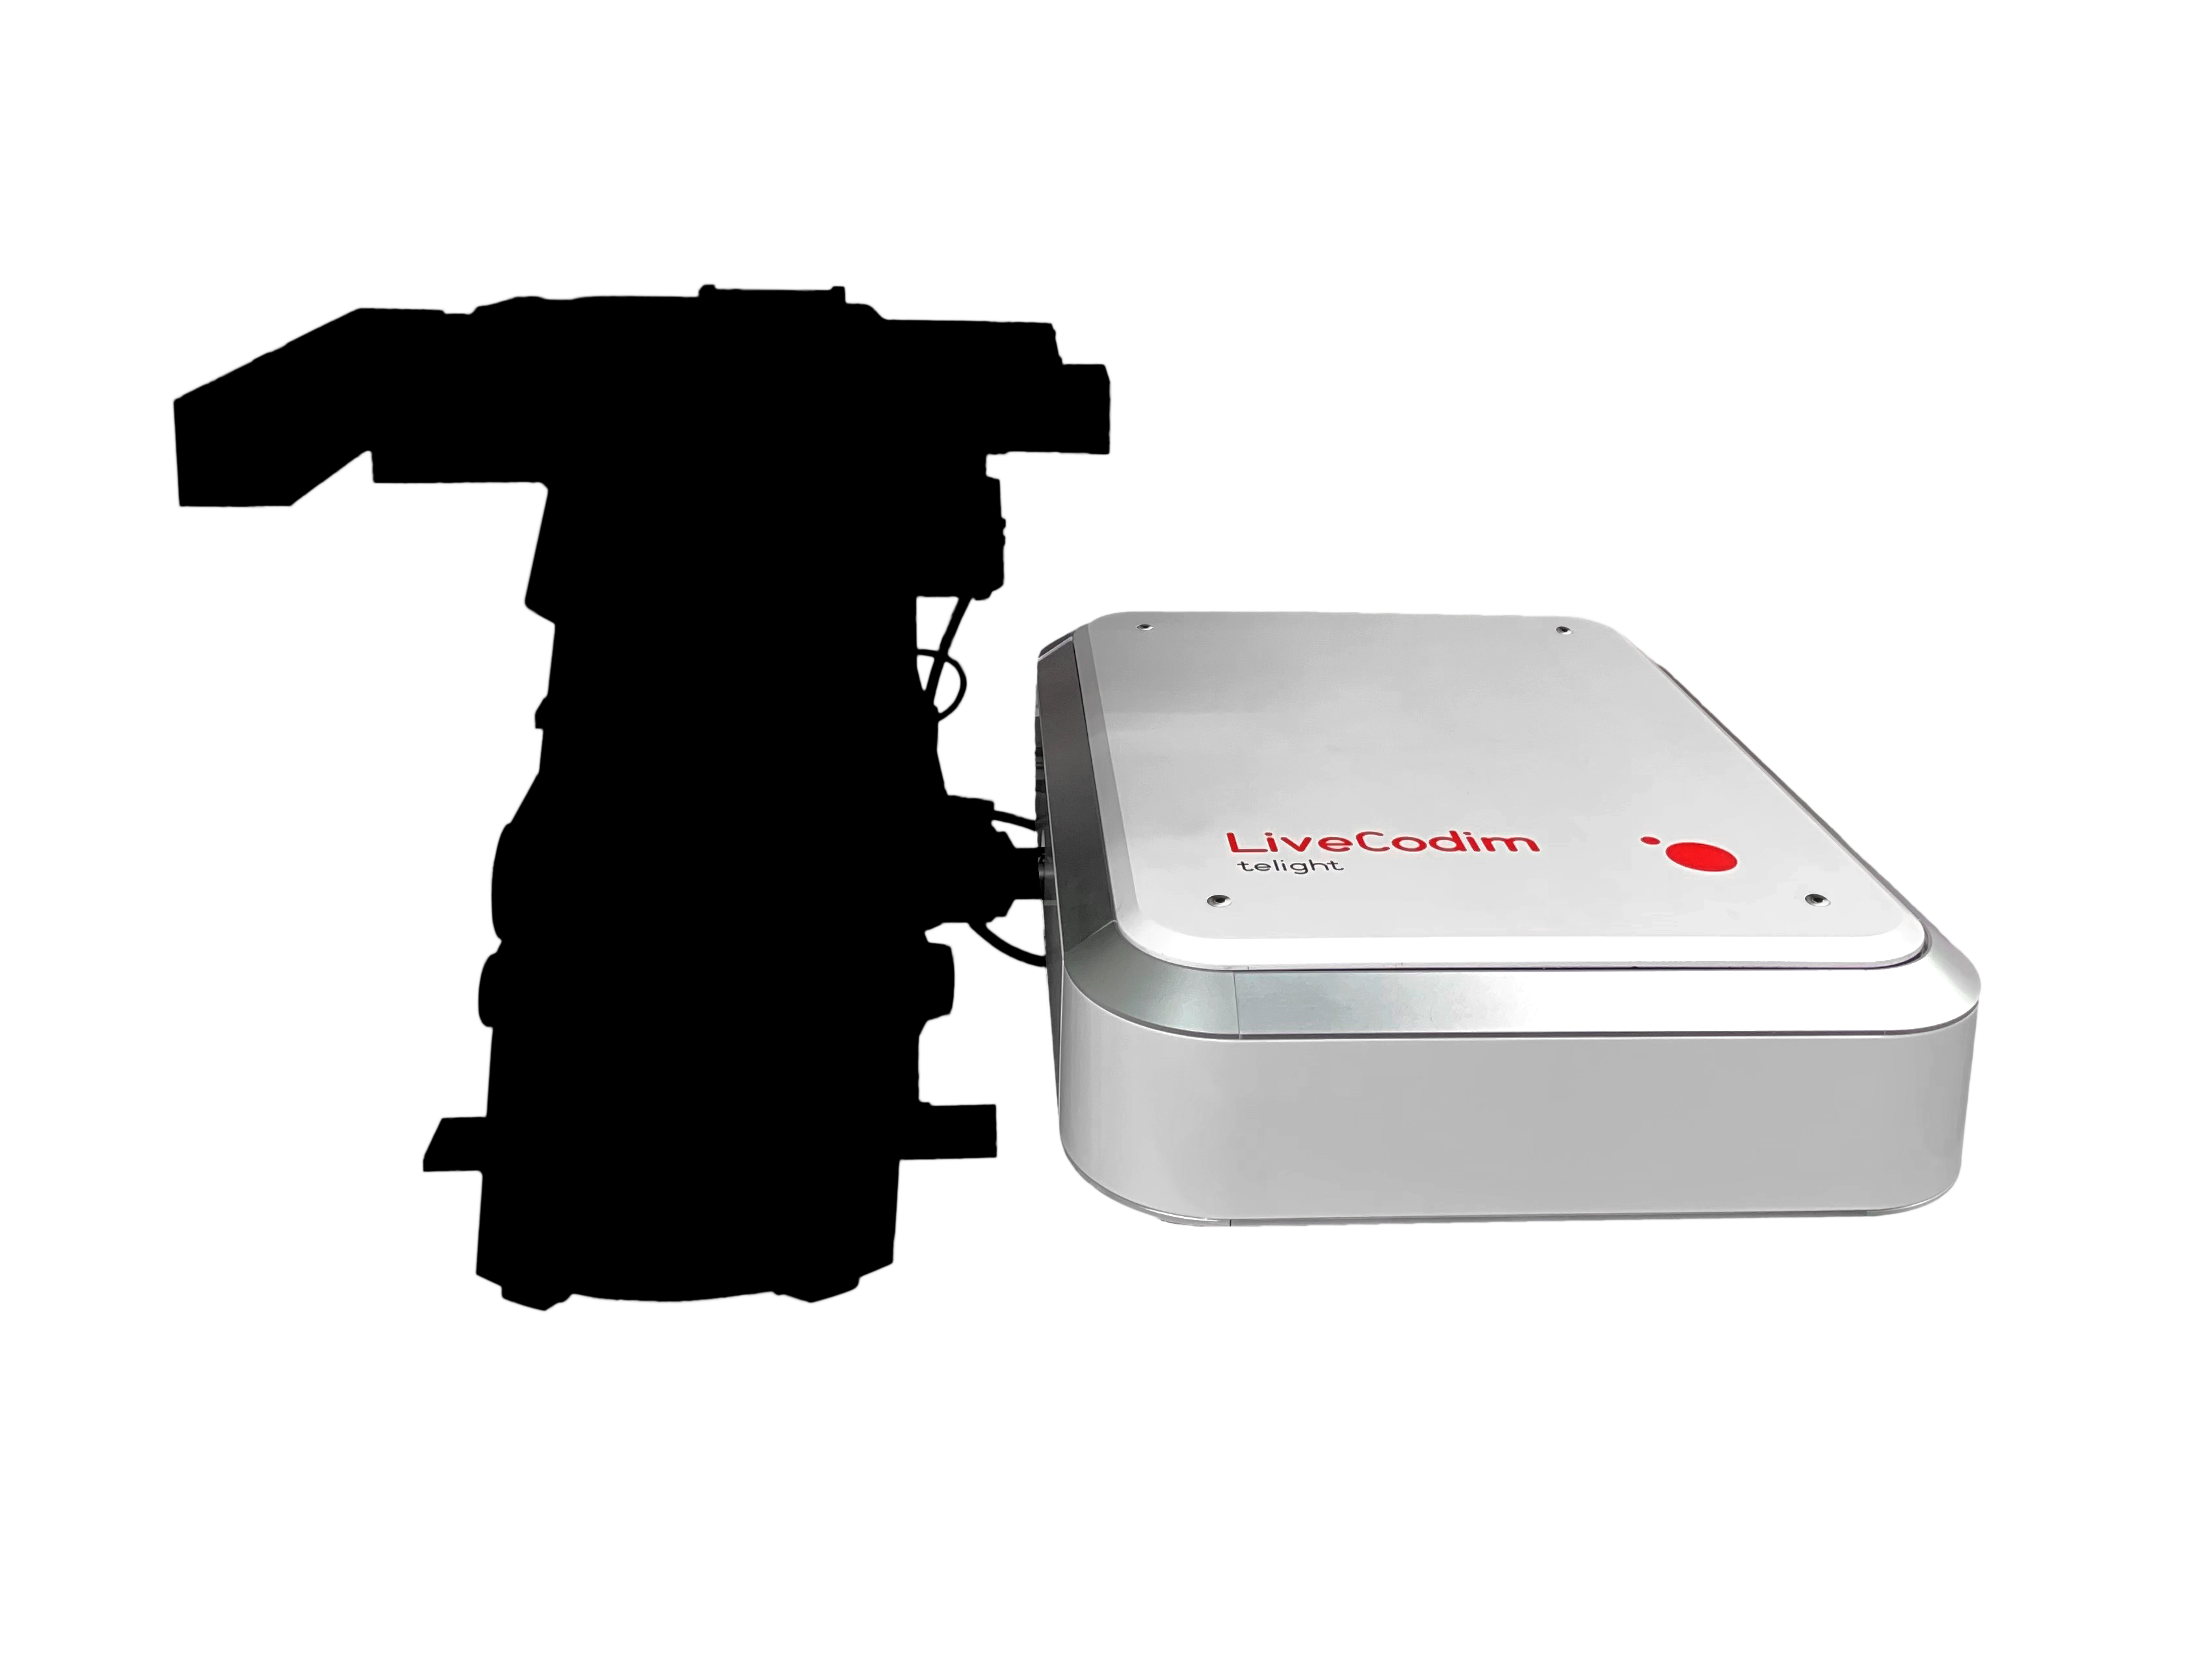
LiveCodim
From conventional to super-resolution microscopy
LiveCodim is a universal, super-resolution imaging platform designed to interface with any standard fluorescence microscope. It is the solution for live-cell imaging with high resolution and low phototoxicity.