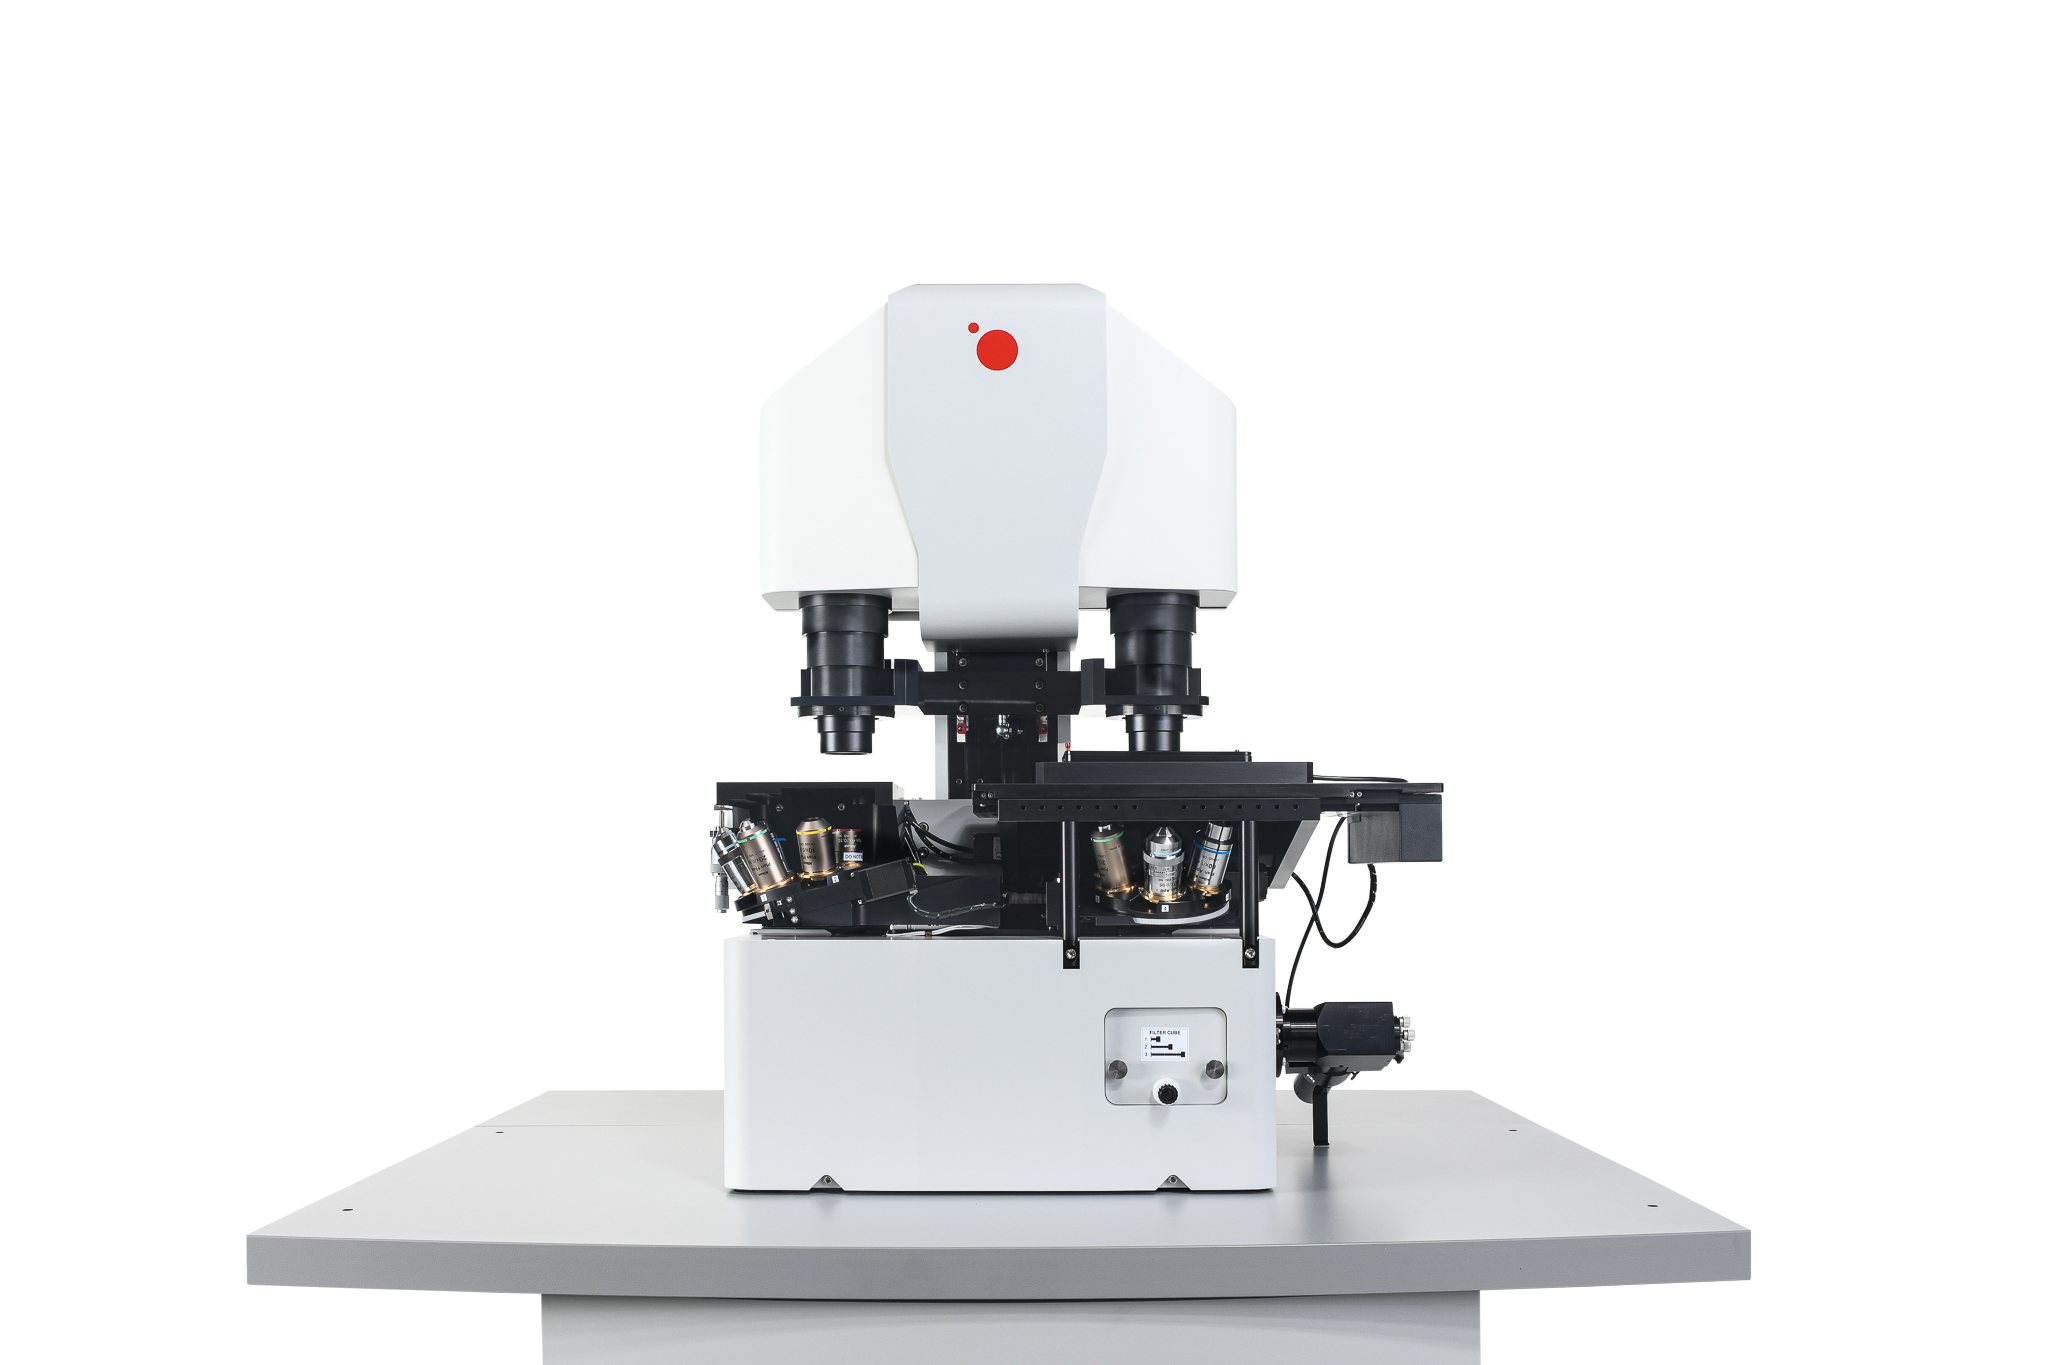
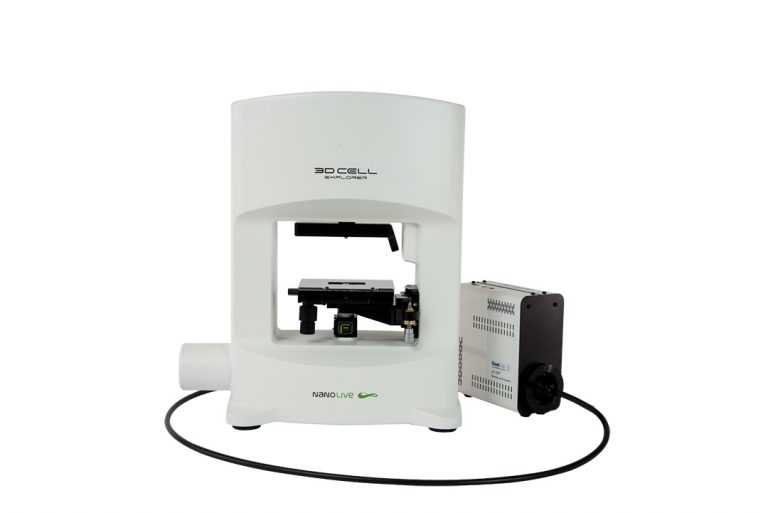
Q-Phase comparison to Nanolive 3D Cell Explorer-fluo
This article presents a comparison of two Quantitative Phase Imaging (QPI) microscopes: the Telight Q-Phase and the Nanolive 3D Cell Explorer-fluo. These microscopes are used for label-free visualization of living cells, providing insights into cell morphology and biophysical properties.
The study conducted by Věra Chvalová, Tomáš Vomastek, and Tomáš Groušl focuses on how these microscopes perform in imaging and analyzing two distinct cell lines: the cuboidal epithelial MDCK cells and solitary growing Rat2 fibroblasts. The key aspect of the research is to evaluate the microscopes’ capabilities in terms of single-cell segmentation and the quality of quantitative data derived from the segmented images.
Link to the full article published in the Journal of Microscopy – RMS.


The software SophiQ (Telight) and Eve (Nanolive) offer the possibility to automatically segment individual cells from quantitative phase images. Representative quantitative phase images generated by Telight’s Q-Phase microscope and segmented with SophiQ software (two left columns) and quantitative phase images generated by Nanolive’s 3D Cell Explorer-fluo microscope and segmented with Eve software (two right columns). Images of epithelial MDCK cell lines are shown in the top two rows, and Rat2 fibroblasts are in the bottom two rows. The enlarged image corresponds to the white square in the image to its left side. Scale bars = 50 μm.
Microscope Technologies
The Q-Phase microscope employs coherence-controlled holographic microscopy (CCHM) with LED light, offering high-contrast images suitable for precise cell segmentation. The 3D Cell Explorer-fluo uses laser-based holotomography, allowing detailed 3D visualization of cell internal structures.
Image Analysis Software
The Q-Phase’s ‘SophiQ’ software and the 3D Cell Explorer-fluo’s ‘Eve’ software were assessed for their segmentation abilities. SophiQ offers multiple adjustable parameters for precise segmentation, while Eve provides simpler, less adjustable segmentation with only one parameter. Manual editations are not possible with Nanolive’s software.
Performance in Cell Imaging
Both microscopes effectively capture high-resolution images with visible internal structures of cells. The obtained images with superior contrast are suitable for further processing by the integrated software modules.
Field of view comparison
Images from the Q-Phase microscope was acquired using 20X magnification objective with FOV 296×296 μm, thus allowing to capture more cells in shorter time, while the data from 3D Cell Explorer-fluo were obtained using 60X magnification objective with FOV 90x90x30 μm. The employment of higher NA objective demonstrated strength in detailing minor differences within cells, however, final images from 3D Cell Explorer-fluo presented in the image above are stitched, compared to Q-Phase data which are single shot.

Each software offers a different segmentation approach and result. (A) Telight’s SophiQ allows manual corrections after the automatic segmentation of single cells. The original image of the MDCK cell cluster generated with the Q-Phase microscope is shown (left image), the status after automatic segmentation shows the imperfection of the segmentation process (middle image); the top two arrows show two cells that were incorrectly considered as one cell by the software, the bottom arrow shows an impurity in the medium that was incorrectly assigned as part of the cell. The status after manual correction is shown in the right image; the joined cells were split, and the impurity was corrected. Scale bar = 50 μm.
(B) Nanolive’s Eve sometimes struggles to segment the cells in compact colonies, such as the MDCK cell cluster shown here. The left image shows the original non segmented image of the MDCK cells taken with the 3D Cell Explorer-fluo microscope. The result of the automatic segmentation by the Eve software is shown in the right image. The arrows point to the cells that were incorrectly joined together by the software. The cell colony in the upper-right corner of the image was segmented correctly because the colony is not as compact as the one in the middle. Scale bar = 50 μm.
Application and Flexibility
The Q-Phase is adaptable to various types of cultivation plates and dishes, whereas the 3D Cell Explorer-fluo is more limited, it requires to use dishes compatible with the instrument dish holder, produced by Nanolive.
Comparative Advantages of Q-Phase
- Offers different objectives for varied imaging needs. (Q-Phase can have up to 6 objectives, depending on the configuration.)
- Provides flexibility in sample preparation, accommodating a variety of dish types.
- Features SophiQ software with multiple adjustable parameters for precise cell segmentation, including manual editation capabilities.
- Suitable for detailed segmentation of both sparsely growing Rat2 cells and densely packed MDCK cell colonies.
- Q-Phase is more suitable for research with MDCK cells.
Nanolive 3D Cell Explorer-fluo
- Uses a single objective optimized for its system.
- Simpler segmentation setup.
- Smaller size than the Q-Phase.