

Cell death
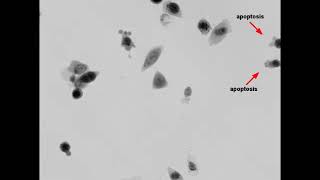
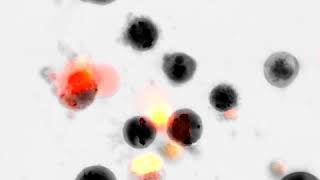
Cell death is essential for maintaining homeostasis in an organism, as it regulates cell populations. We distinguish between non-lytic cell death (apoptosis) and lytic cell death (e.g., necrosis) based on morphological changes.
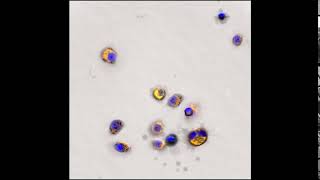
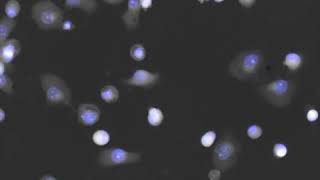
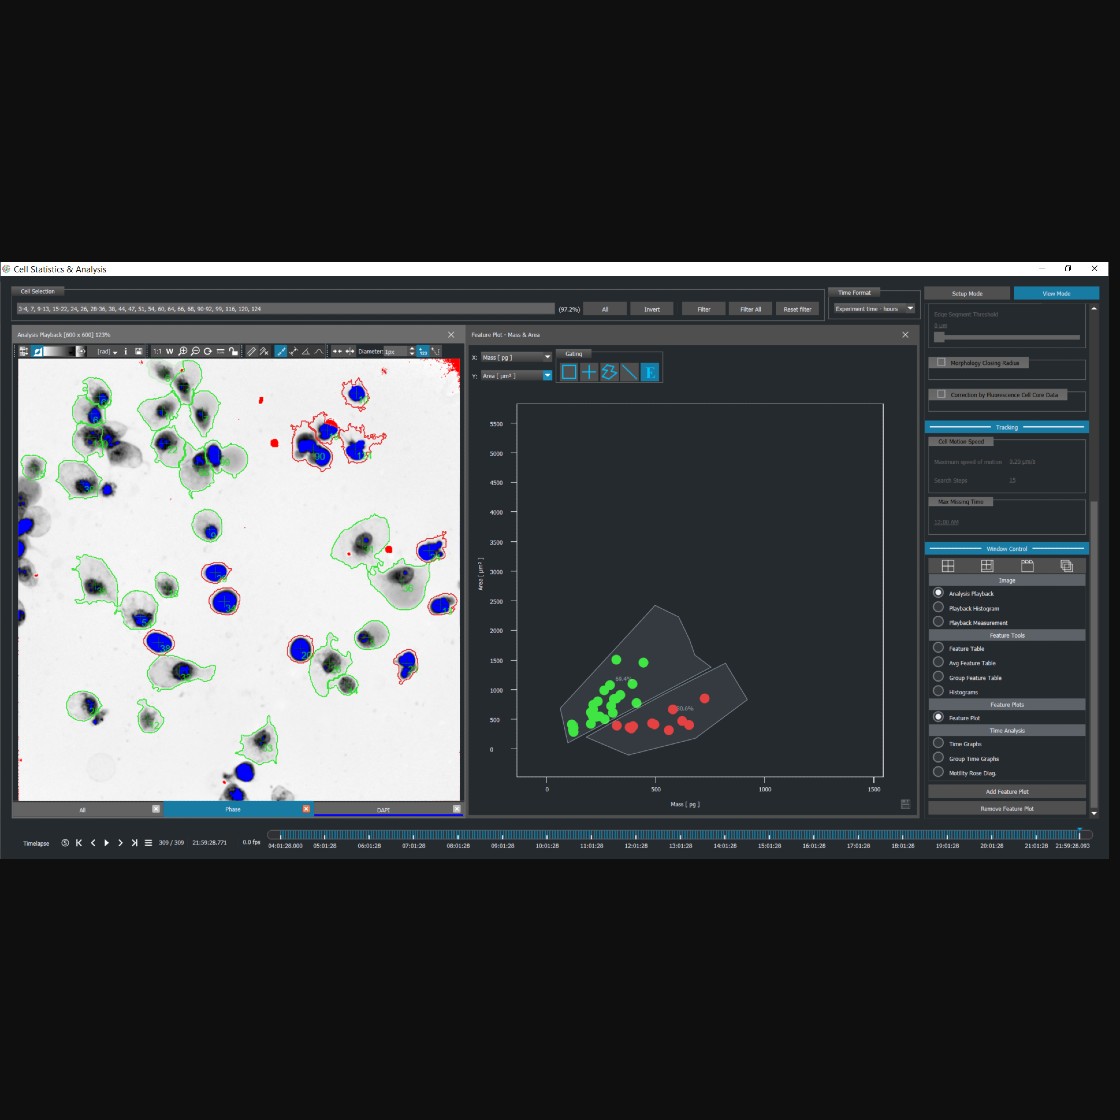
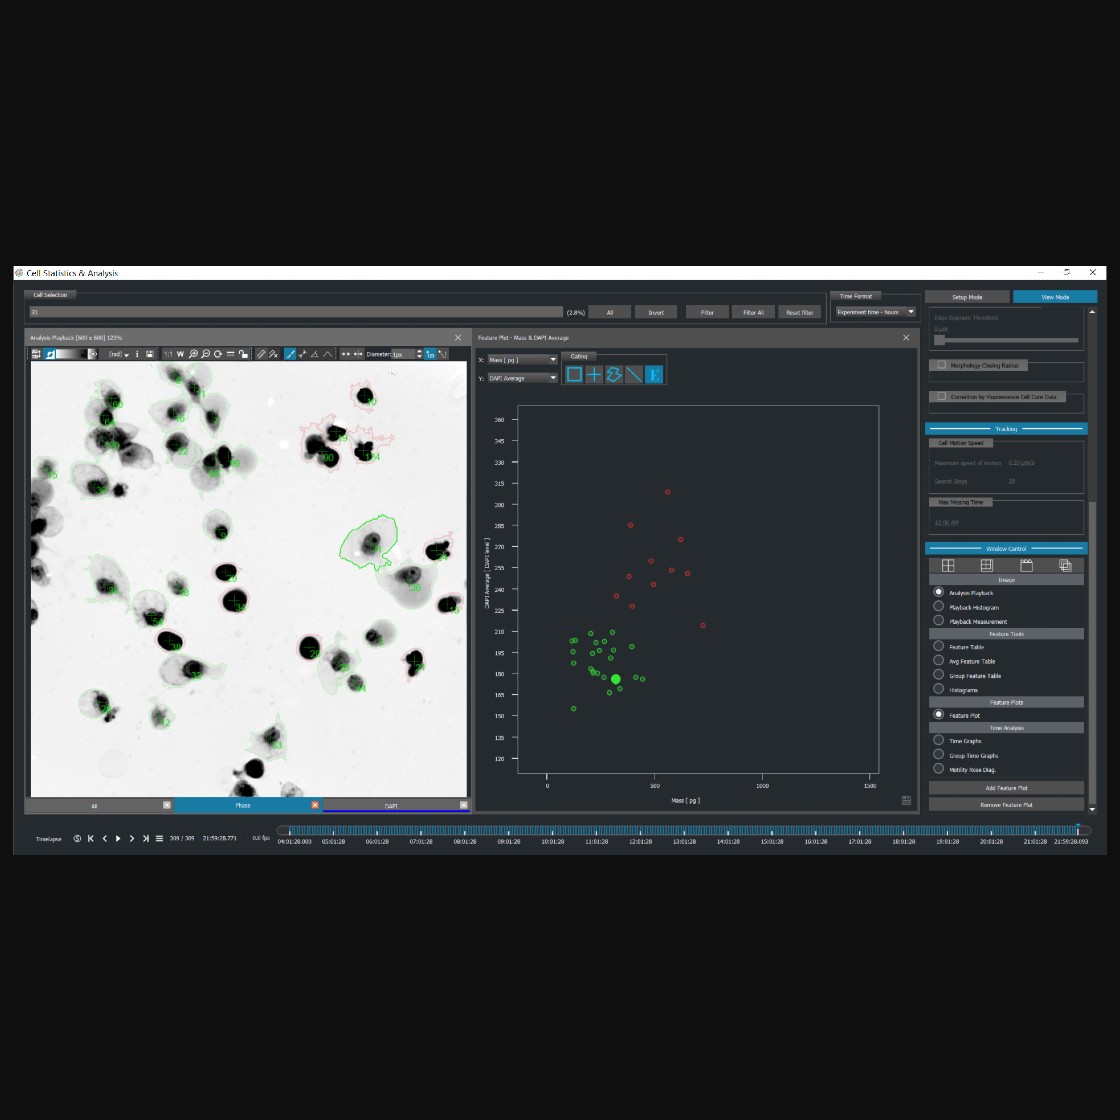
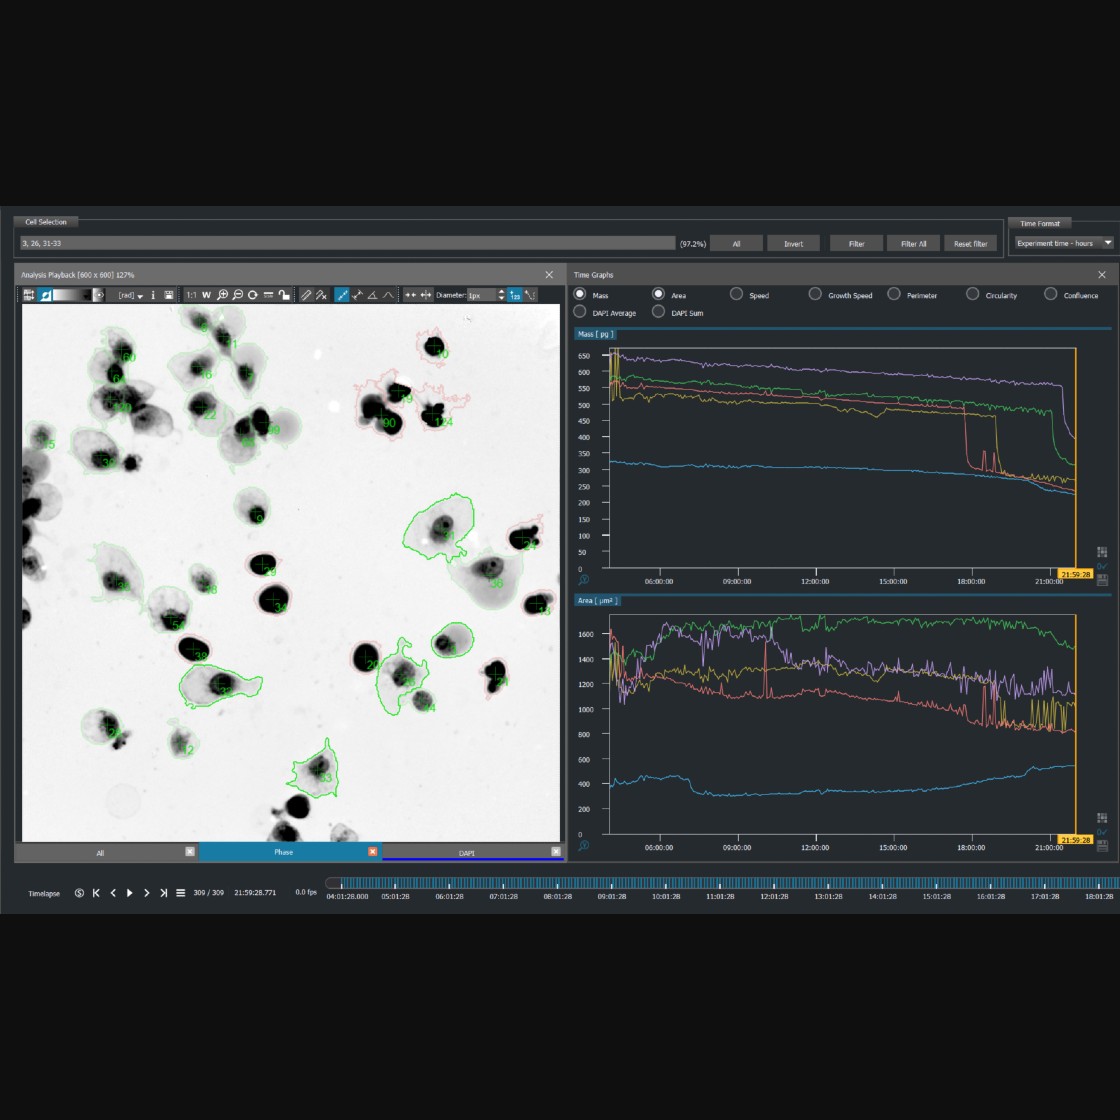
With Quantitative Phase Imaging (QPI) technology, it is possible to precisely detect and quantify changes related to both morphological and dynamic parameters. This advanced imaging technique enables continuous monitoring of individual cells over time, providing insights into their responses to drug treatments or stress conditions. Furthermore, QPI allows for assessing viable and dead cell fractions within large populations by measuring changes in cell mass.
Understanding cell death is crucial for medical advancements, from cancer research to neurodegenerative disease treatments. Quantitative Phase Imaging (QPI) provides this by measuring actual cell mass changes, offering unparalleled insights into cellular behavior, treatment effects, and disease progression.
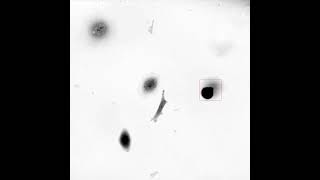
Different cell death modalities are characterized by their specific sequential morphological patterns.
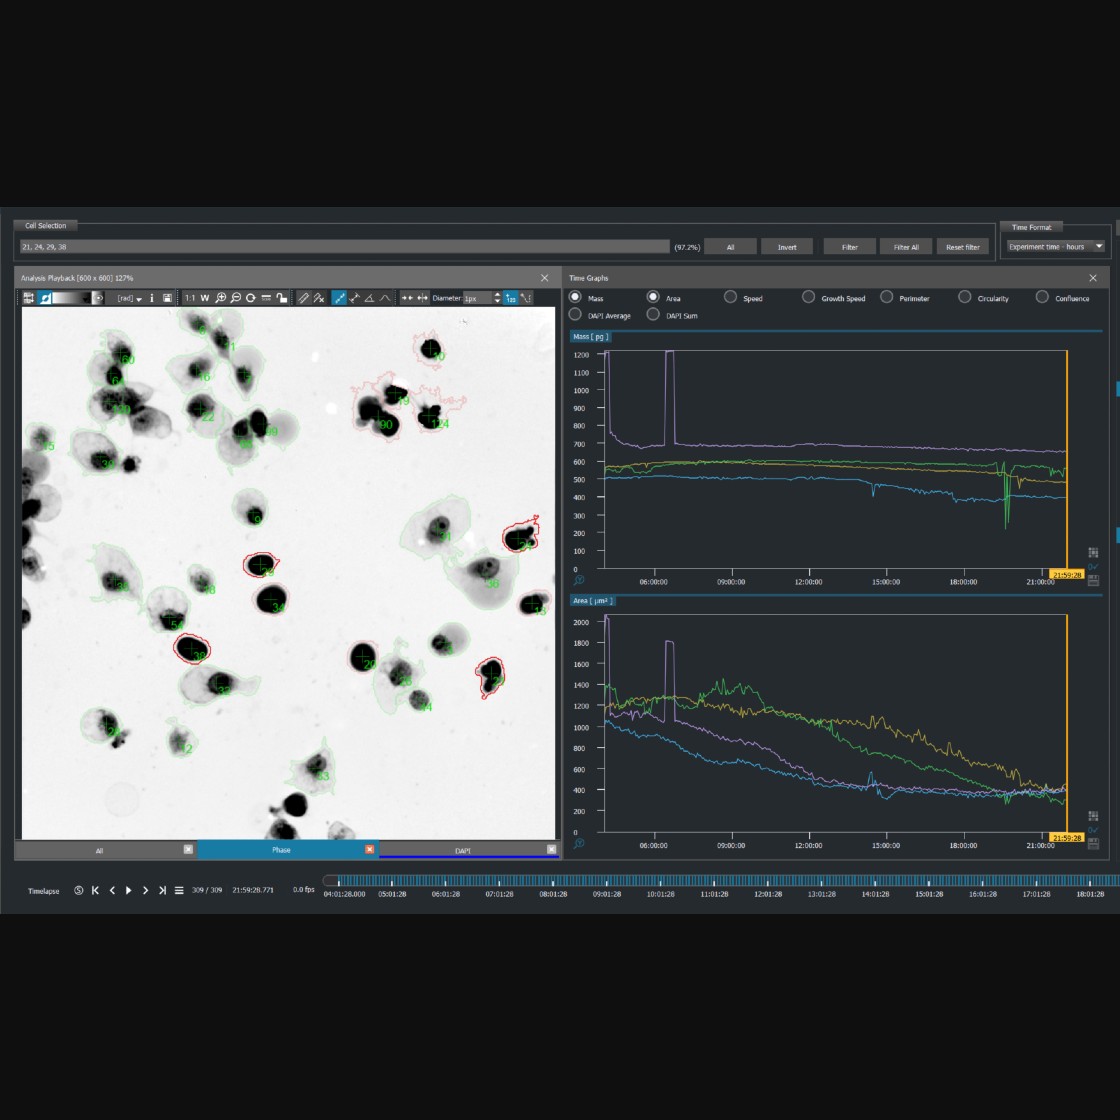
Q-Phase detects the quantitative values of cell dry mass and morphological changes of each cell across time, thus providing a rapid and label-free method for the prediction of the provisional type of cell death.
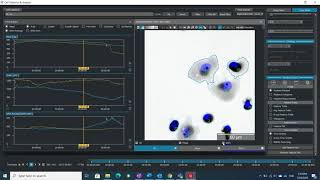
Moreover, Q-Phase constitutes a comprehensive tool that merges both QPI and fluorescence which allows for studying the time-dependent morphological changes simultaneously with the concomitant biochemical markers.
Publications
Coherence-controlled holographic microscopy enabled recognition of necrosis as the mechanism of cancer cells death after exposure to cytopathic turbid emulsion
Multimodal Holographic Microscopy: Distinction between Apoptosis and Oncosis
The Quantitative-Phase Dynamics of Apoptosis and Lytic Cell Death
Quantitative Phase Dynamics of Cancer Cell Populations Affected by Blue Light
Products
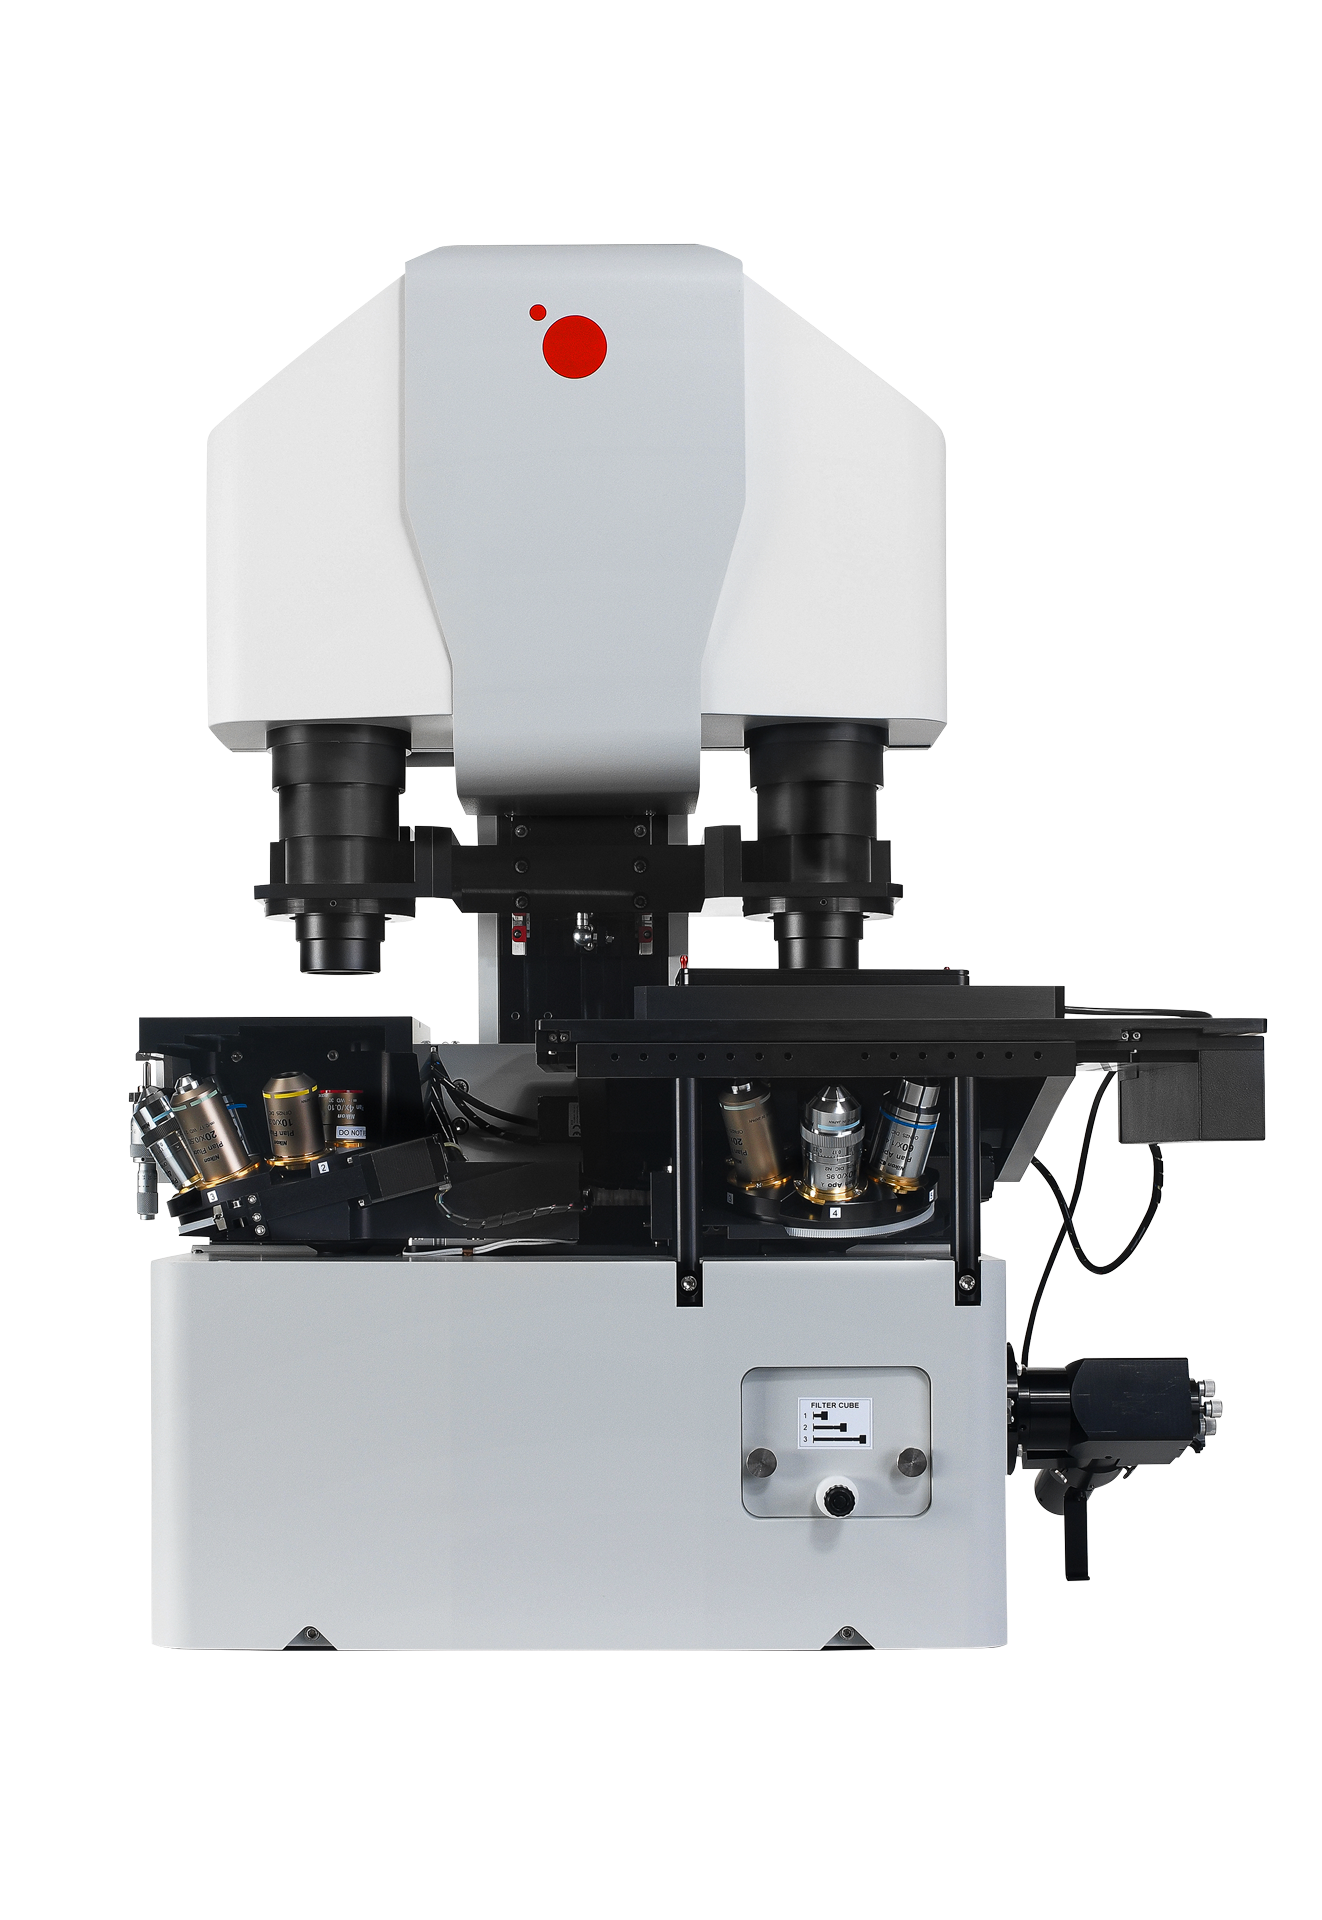
Telight Q-Phase
Quantitative Phase Imaging
Q-Phase is a patented holographic microscope with high detection sensitivity, designed for gentle live-cell imaging.
Q-Phase is an ideal solution for experts who desire precise automated segmentation of individual cells for subsequent data analysis. Q-Phase quickly transforms cell features and dynamics into numerical data suitable for comparisons, correlations, and more detailed statistics.
Telight LiveCodim
From conventional to super-resolution microscopy
LiveCodim is a universal, super-resolution imaging platform designed to interface with any standard fluorescence microscope. It is the solution for live-cell imaging with high resolution and low phototoxicity.